

How to contribute and get involved
Consider hosting an air quality monitor at your home to improve the quality and reach of the air quality sensor network in your community. After connecting your AirU monitor to your home Wi-Fi network, you will see the contribution of your AirU monitor on the AirView map within 1-hour. Learn moreHow to make sense of air quality data
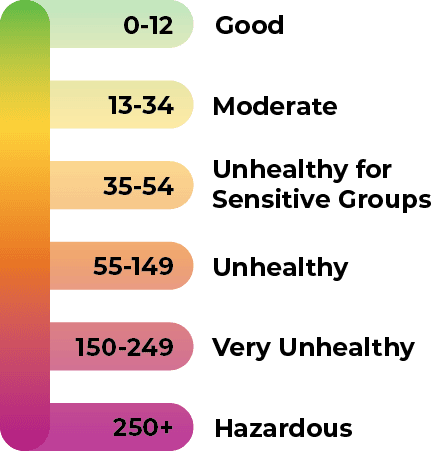
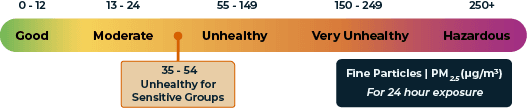
What is AQI (Air Quality Index)?
AQI is the EPA's index for reporting air quality. Higher AQI values indicate greater air pollution and associated health concerns.AQI and PM2.5:
This map shows Fine Particulates (PM2.5), which are a key air quality metric used to calculate the AQI. Some are emitted directly from sources, such as construction sites, unpaved roads, vehicle emissions, smokestacks, fires, and other combustion sources. A large fraction of particles form in the atmosphere as a result of complex reactions of chemicals such as sulfur dioxide, volatile organic compounds, and nitrogen oxides, which are pollutants emitted from power plants, industries, and automobiles.Other primary pollutants in AQI calculations include course particulates (PM10), ozone, nitrogen dioxide, and sulfur dioxide.